Portfolio

April 13, 2022
Over the next several months, our team at MKB will be releasing a series of blog posts with monthly themes related to our focus sectors of energy, mobility, the built environment, and related industrials. We aim to provide insight into the subjects that we spend our time navigating and in which we look for opportunities to make thoughtful investments and use our capital to accelerate change.
The first theme in October will be the battery supply chain, where we’ll dive into topics such as critical minerals, manufacturing, and end-of-life circularity. Among other topics, we’ll also cover material related to building and vehicle electrification, industrial decarbonization, and our rapidly evolving electrical grid.
Before exploring our monthly themes, we begin with our broader 2023 market perspective. This overview discusses how our focus sectors have evolved from the vertical-specific, narrower opportunity sets in the early days of the energy transition into the ripe, integrative opportunities that they are today. We examine how in this next climate tech epoch, the convergence vectors of technology, capital, policy, and demand are creating a multiplier effect that allows transition-enabling solutions to achieve scale. The inflection point of the transformation towards decarbonized economic systems has occurred, and a rich investment landscape of growing companies has emerged. We are excited to share our observations and viewpoints on this environment.
Cleantech 1.0 – The recent history of the energy transition has been simultaneously challenging and inspirational, and its pioneers both venerated and derided. Whether labeled cleantech, climate tech, or greentech, the sector has for decades sought innovative replacements to fossil fuels as the source of energy for practically all aspects of the modern economy. The durable climate tech era began in the 2006 Cleantech 1.0 period, as the levers of policy opened doors for innovation. The hallmark of the global climate tech policy landscape, however, was its inconsistent and unpredictable nature. In the U.S., tax credits aiming to spur renewables failed to provide long-term visibility to developers. Certain tax credits were extended in short one or two-year spurts as many as 12 times before 2020, often as adders to unrelated legislation, and in some cases retroactively after expiring. While tax equity investment was a key driver of project funding, the Financial Crisis of 2008 wiped out the tax burdens of many investors and dried up demand. Congress did respond swiftly with the passage of American Recovery and Reinvestment Act of 2009 to spur renewed investment. However, these stop-gap measures were isolated efforts which did not result in long-term policy certainty.
Global policy levers over the last two decades have been rather blunt instruments. They have, however, done their job of creating market space for low-carbon solutions to reduce costs via rapidly growing deployments. Wind and solar followed learning curves to reduce costs by 15% and 24% respectively per annum over the full period studied by the US Department of Energy1 (see figure below). This led renewables to grow from 16% to 30% of the OECD power mix between 2000 and 20202. Similarly, energy storage costs dropped by 88% between 2010 and 20223. The policy approaches other than tax credits have typically taken the form of premium payments for green energy supplied to the grid. In Europe and Ontario, wind and solar were subsidized with a simpler Feed-in Tariff scheme. This led to rapid market growth of both generation sources, especially in Germany, which is not known for its particularly sunny conditions.
LCOE-based Learned Curves for Utility-scale Solar and Wind
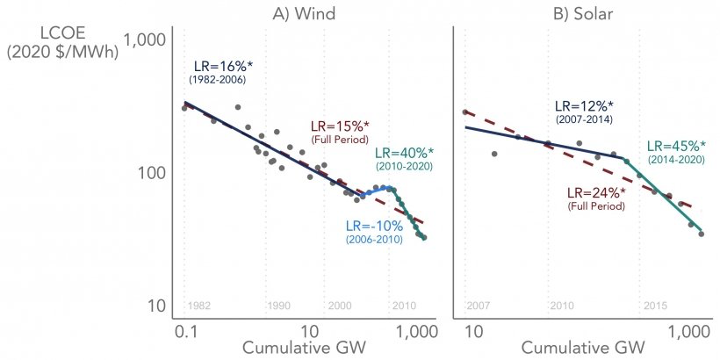
Source: US Department of Energy
Cleantech 2.0 – The Cleantech 2.0 period from around 2012 until the present has seen significant advances in energy technology performance coincide with sharp cost declines. This occurred despite a backdrop of public discourse which questioned climate change and its causes. Clean technologies achieved costs low enough to spur low-carbon power and transportation purchasing decisions based on economic merits. In many parts of the world, wind and solar became the cheapest form of power generation and started to outcompete fossil-fueled electricity production. The technology also became more complex as economic parity opened the floodgates of innovation. Consumer and corporate sentiment, which ultimately came to favor lower-carbon and net-zero approaches to economic activity, eventually became a tailwind for innovation. The resulting business models and market structures manifesting today do not resemble legacy centralized power systems and fossil-fuel based transportation infrastructure. This is good news for decarbonization efforts because conventional power systems are expensive and inefficient. Only about 20% to 30% of fossil fuel, converted into power in a centralized thermal power plant, is harnessed for useful work. The rest is wasted into the atmosphere in the form of heat, carbon emissions, and local air pollutants. Fossil-fueled, internal combustion engine-based transportation shares similar negative attributes. Electric vehicles have reached a scaling inflection point because they are three-to-four times more efficient, do not emit local air pollutants, and produce less CO2. EV growth will continue to accelerate as up-front costs and charging convenience reach parity with conventional vehicles.
Comparison of Internal Combustion Engine (ICE) and Electric Vehicle (EV) Efficiency
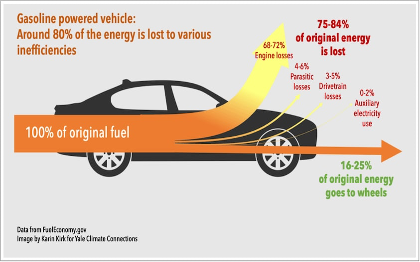

Source: Yale Climate Connections4
The decentralization trend impacts not just emissions; it portends a more flexible and resilient energy system, which to some extent establishes a defense against global challenges emerging today. The invasion of Ukraine has thrown global energy security into question. Covid-induced global supply chain shocks and relief spending by governments has also driven high core inflation growth. Interest rate hikes exhibit the perverse effect of temporarily reducing the volume of economically producible fossil fuels, exacerbating energy inflation, and pulling more of the world’s poor into energy poverty. This compels governments to exploit cheaper, higher-emitting resources, such as Germany’s recent decision to revive coal-fired power plants – a temporary salve but a long-term climate albatross.
Today’s Challenges – Because these sectors contribute materially all of the industry-borne carbon not emitted by agriculture, their clean-up and optimization unlock the dual incentive of lower and less-volatile costs over the long term. This dynamic underpins MKB’s conviction on the four sectors of our thesis:
A New Era: Climate Tech 3.0 – To address these problems, the climate tech progress of the last two decades resulted in four rapidly converging vectors which have created the conditions for unprecedented scaling. This convergence marks the beginning of the Climate Tech 3.0 investment opportunity. While energy transition investment historically has focused on advancing technology within discrete and rigid verticals, the sector has evolved to demand system-level thinking from innovators, investors, and policymakers. A system-level approach is framed by MKB’s macro theme of convergence to scale. The four key vectors, which are aligning to make this the right time to invest for scale, are technology, capital, policy, and demand.
1. Technology – The Technology vector is fueled foremost by data, which allows robotics and other automation modalities to act in concert and conduct themselves beneficially as systems rather than components. Edge computing platforms have evolved with ultra-fast software to capture extraordinarily granular data from cheap, ubiquitous sensors monitoring the edge of a network. The analytics performed at the edge may be simple calculations, or complex, predictive computations derived from the ingestion of thousands of data sources into a machine learning or artificial intelligence engine. The results are rapidly, cheaply, and optimally transmitted to a cloud environment, where additional analytics may consider optimizations at the facility, region, or enterprise level to save energy and production costs. Taken together, these data-driven approaches have the potential to morph the Internet of Things into an Internet of Energy. Additionally, ever-declining costs of renewables, batteries, and computing power has been critical to encouraging adoption and creating new business models.
2. Capital – The Capital vector has grown to where it can support both deployment and innovation of low-carbon technologies at scale. From a deployment perspective, US$186 billion was invested in low-carbon technologies in the Americas region in 2022, growing by 116% since MKB’s Fund I was launched in 2016.5 Deployment capital has diversified from its initial focus on renewable energy—major growth areas now include electrified transport, electrified heat, energy storage, and sustainable materials. Much like renewable energy in the last decade, technologies in these sectors are becoming mature and broadly bankable by traditional project finance and infrastructure investors. Innovation capital is also more widely available than ever before in energy transition sectors. While the rest of the venture capital market slowed due to macro forces in 2022, global climate tech venture capital funding grew to over US$70 billion, which is 210% higher than in 2020.6 There are also more publicly traded companies in climate tech sectors than ever before.
3. Policy – The Policy vector has reached a point of unprecedented long-term visibility over regulatory rules, incentives, and ambitions. From an investment standpoint, policy levers opening markets to technology have never been stronger or more durable. Biden’s Inflation Reduction Act (IRA), signed into law in August 2022, contains US$500 billion, with US$370 billion targeted at clean energy through tax incentives, grants, and loan guarantees.7 The Infrastructure Investment and Jobs Act (IIJA) represents US$550 billion in new spending and US$650 billion in previously authorized funding to rebuild infrastructure, expand access to clean drinking water, high-speed internet, tackle the climate crisis, and advance environmental justice.8 More specifically, the IIJA provides US$7.5 billion for EV charging infrastructure, which includes the US$5 billion National Electric Vehicle Infrastructure (NEVI) program.9 Further, the CHIPS & Science Act contains another US$280 billion targeting domestic semiconductor manufacturing capacity.10 Together, this US policy has impelled a new ‘space race’ for climate change with strong support demonstrated through public funding allocation.
Canada has followed suit with the announcement of its $15 billion Canada Growth Fund to encourage private investment in low-carbon projects, technologies, businesses, and supply chains.11 It also introduces refundable tax credits worth up to 30% of investment costs related to net-zero technologies, battery storage, and clean hydrogen.12 Further, Budget 2023 proposes $500 million over 10 years to the nation’s Strategic Innovation Fund (SIF) for the development of clean technologies in Canada.13 In addition, the Canada Infrastructure Bank launched an initiative to invest $500 million in large-scale zero-emission vehicle charging and hydrogen refueling infrastructure, with complementary programs from Natural Resources Canada and Transport Canada.14 Notably, Canada has created a new regulated carbon market with its Clean Fuel Standard published in July 2022, with the intent to achieve 30 million tonnes of annual reductions in greenhouse gas emissions by 2030, as part of the target to reduce national emissions to 30% below 2005 levels by then.15 Collectively, the Canadian government is also injecting impact-driven public funding to propel the energy transition.
The EU Commission has responded with its Green Deal Industrial Plan as well as its Critical Raw Materials Act.16 Public policy has never been so bold, wide, or progressive and this will undoubtedly accelerate decarbonization, electrification, and related infrastructure rollouts, while also promoting the reshoring or nearshoring of supply chains.
Investment in the Deployment of Low-carbon Technologies by Sector
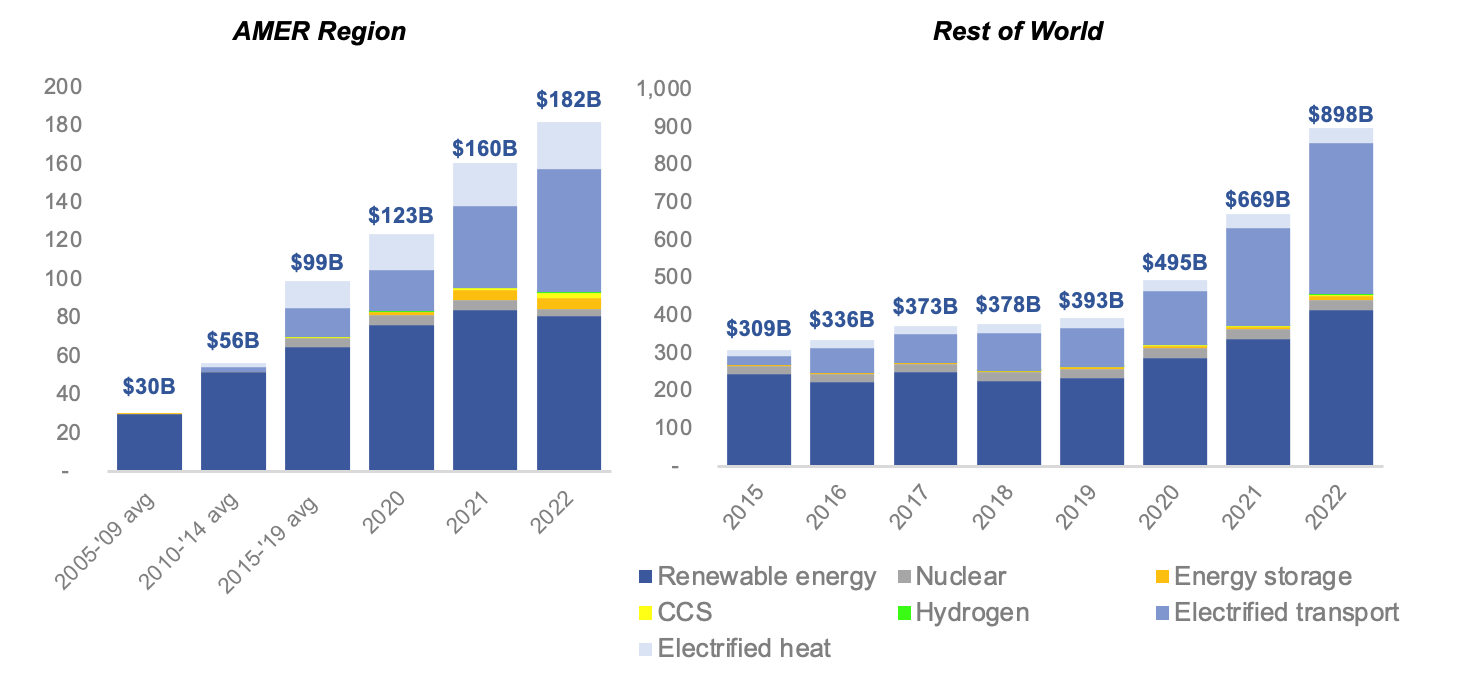
Source: BloombergNEF17
4. Demand – The Demand vector historically has been most closely tied to policy but has now passed an inflection point where the lower carbon purchasing decision is often the most economically rational as well. Public sentiment around the world broadly favors climate action, spurring policies to drive market entry against incumbent products and energy sources. From there, innovation has driven low-carbon technologies to their current competitive price points. Consumers have taken notice and become increasingly conscientious about their purchasing decisions. Corporations, too, have shifted; while public sentiment may influence the considerable number of net-zero pledges, low-carbon lifecycle economics has become a mainstay of corporate purchasing decisions. Heavy carbon emitters also recognize the risk to their license to operate due to the production of unabated emissions. However, these corporate pledges, and the actions behind them, have varying implications. Petrochemical and hydrocarbon producers face a joint dilemma with governments – society relies on them continuing to produce over the next several decades, but the public increasingly demands decarbonized solutions. Producers have responded to this demand by joining net-zero pledges, and reducing emissions intensity for incumbent energy sources while creating additional market pull for completely decarbonized solutions.
A profound secular transformation of our global economy is well in motion, and the convergence of these four vectors creates specific opportunities for scale to address today’s challenges in each of the four sectors within MKB’s investment thesis.
Energy Sector – In the Energy segment, distributed power resources historically have been economically disadvantaged by legacy market structures restricting their ability to scale, but policy is now catching up with the technology. In 2020, for example, the U.S. Federal Energy Regulatory Commission (FERC) approved a watershed set of rules known as FERC Order 2222. For the first time in history, this order is opening wholesale power markets to distributed generation resources. This unlocks a massive market space for innovative business models and technologies while fundamentally changing how the grid – and utilities – operate. Utilities who do not rapidly partner with nimble distributed resources providers may see their revenues pulled away by aggregators of those resources. This rapid market expansion creates an extraordinary opportunity to derive outsized returns by investing in companies innovative enough to fill this void.
Additional segments of interest in the power sector include those based on a framework which prioritizes capital efficient approaches which can scale rapidly to have large impacts on emissions or efficiency – or enable other technologies which do. One such area is grid flexibility, the legacy power value chain’s primary limitation. With fossil fuel or nuclear-generated power typically providing a baseload of power, supply cannot be turned down to accommodate demand swings without serious penalties, and nuclear power in its current state cannot follow load at all. Load-following generation plants must then supplement baseload power to accommodate changes in demand or intermittent renewable supply. Baseload power historically has provided a critical function – power stability, roughly indicated by grid frequency. However, in the UK for example, regulations reduced coal-fired power to almost nothing in the years preceding the Covid-19 pandemic. When Covid struck, electricity demand dropped precipitously, and at times renewables provided as much as three-fourths of energy supplied. Grid stability was maintained by paying nuclear plants to shut down their inflexible units to make room for gas turbine generators to follow load. This action cost electric ratepayers substantial sums, resulting in policy actions such as the creation of ‘green inertia’ markets. These markets in turn are spurring innovations such as generators which absorb rather than produce power, fast-acting energy storage, and grid-forming inverters. Of these three solutions, fast energy storage is perhaps best suited to scale in the near term due to its own Convergence Vector attributes, and the scaling of fast storage holds promise to alleviate inertia loss as a large and costly impediment to decarbonizing the power sector.
MKB also anticipates renewables are to maintain their rapid growth, with utility-scale solar PV and onshore wind emerging as the most cost-effective options for new electricity generation across most nations worldwide. Projections suggest that within the next five years, renewables will double in capacity, with solar power alone expected to triple between 2022 and 2027. The growth of Distributed Energy Resources (DER) will continue to drive innovation deployment models, design software, installation processes, optimization techniques, workflow management, and asset monitoring technology.
Mobility Sector – The mobility technology realm is amid its most pivotal transition since the inception of widespread passenger vehicle adoption. Convergence vectors are driving trends like electrification, digital-enablement, and the sharing economy, which have become cemented in the status quo but have not yet achieved full scale.
Electric vehicles (EVs) are eclipsing their initial status as niche products for wealthy early adopters; mass electrification has gained a sense of inevitability as electric mobility has grown to reach the early majority in many markets across the world. Over 30% of new vehicle sales in Q4 2022 in China and Europe were electric and approximately 10% over the same period in the United States and Canada.18
While North America lags other regions in its progression towards electrification, the alignment of convergence vectors will enable it to reach and exceed the phase of transition currently achieved by its international peers within short order. US policies enacted in 2021 and 2022 facilitate both the supply- and demand-side conditions for comprehensive adoption of EVs. The IRA creates consumer subsidies for North American-made EVs to reduce any remaining cost disparity between EVs and internal combustion engine vehicles for less wealthy consumers. The IRA and the CHIPS Act enable EVs and their components to be increasingly manufactured locally in a way which enables them to qualify for the IRA’s consumer subsidies. The IIJA unlocked US$7.5 billion of funding for EV charging to help assuage potential and existing EV buyers’ yet persistent range anxiety. Canada Infrastructure Bank’s (CIB) $500 million Charging and Hydrogen Refueling Infrastructure Initiative is on track to achieve a similar goal. Battery technology improvements, in terms of energy density and cost, as well as the quality and variety of EVs available, has increased drastically since 2020 and will continue to do so through 2030. This has made the choice to buy electric significantly more attractive for consumers, regardless of their motivation by decarbonization. Corporates key to the EV supply chain have invested hundreds of billions in R&D and capex for scaled manufacturing facilities to build vehicles, batteries, and charging stations.
Paradigm shifts in the mobility market go beyond electrification, notably with the rise of digitally enabled shared mobility services. Uber and Lyft are the most visible examples, but this trend exists across different vehicle form factors and vehicle ownership structures. Municipal decision makers in North America and Europe are increasingly endeavoring for the “15-minute city” with the goal of improved sustainability, health, and livability of urban areas. This often means prioritization of policy that enables shared micromobility and car sharing. Technology has improved such that e-bikes and e-scooters have sufficient range to make the service offerings from shared mobility operators compelling. Capital allocators have taken notice of this and further spurred the market by investing approximately US$8.4 billion globally in micromobility companies between 2018 and 2022.19
Built Environment Sector – The built environment refers to human-made structures and spaces, including buildings, roads, and other infrastructure, where we live, recreate, and work.20 Assets within the built environment are intended to have long time horizons, but there is a mismatch between these time horizons and pace of change in physical and digital technologies, as well as the social context in which they exist.
Between buildings’ fossil fuel use for both heat and electricity generation, as well as building material-embodied emissions, buildings represent 33% of global energy- and process-related CO2 emissions. 21 The way in which urban infrastructure around buildings is designed and managed can be similarly impactful. Policy backed by corporate and consumer demand, combined with enabling capital, is accelerating the pace at which change can be implemented. The groundwork has been laid for the economic deployment of technology solutions enabling efficiency and decarbonization at scale across the value chain of buildings and the built environment.
Given that over the life cycle of a typical building, 76% of emissions come from its operations, lowering these emissions is a critical priority. 22 Building electrification through heat pumps is one of the clearest opportunities for actionable efficiency and decarbonization. While there are 190 million heat pump units operational in buildings globally in 2021, the technology still only accounts for 10% of global space heating needs. 23 By using electricity to harness ambient heat from the ground, water, or air, heat pumps can supply useful heat with 1/3rd to 1/5th of electricity used by conventional equipment. Due to steady improvements in energy performance, heat pumps can be relied upon in a growing share of buildings.
As it relates to the embodied emissions from construction and building materials, solutions such as low carbon concrete and prefabricated construction have become increasingly viable and are gaining rapid adoption. Constrained labor supply combined with rising labor costs and high demand for urban real estate creates increased pressure to find new sources of efficiencies. Certain low- or zero-carbon concrete may have lower input costs with similar compressive strength and other safety characteristics as conventional concrete, meaning it is economic to deploy when produced at scale.
Digital technologies and connected infrastructure also present the dual benefit of economic and efficiency savings at the design, construction, and operational phases for assets in the built environment. The continued adoption of 5G infrastructure and fiber optic networks by cities is also enabling new opportunities to improve critical services and optimize transportation and logistics networks via IoT infrastructure.
Industrials Sector – In the electron vs. molecule debate, the much of the industrial sector falls within the Hard to Abate category because it relies heavily on heat inputs, which normally are generated at scale by fossil fuels (molecules). Across the globe in 2020, producers supplied roughly 20 gigatons (Gt) of oil equivalent primary energy to the world’s economy. After conversion losses, around 10 Gt were available for final consumption, of which the industrial sector consumed nearly 3 Gt. Industrial activity accounted for 9.4 Gt of CO2 emitted in 2021 but must shrink to 7 Gt by 2030 to track with the IEA’s Net Zero Emissions by 2050 Scenario (NZE) 24. This will be a herculean effort.
The light industrial segment garners less attention from a carbon perspective than heavily industrialized steel and concrete but is fertile ground for investment to scale innovation. Accounting for about 17% of industrial emissions, light industry is characterized by food, machinery, and consumer goods production, as well as construction and mining. Although the segment consumes about the same amount of energy as it did a decade ago, it emits about one-quarter fewer emissions. This is substantial progress, but more is needed, and fortunately technological pathways for further improvement exist. Fossil fuels account for just below half of energy inputs to light industry, and nearly all of this is to produce heat. Because about 90% of this heat demand is low or medium grade (below 400°C), much of it can be displaced by electrification. Industrial-grade heat pumps achieving temperatures above 100°C have begun entering the market, and units capable of 165°C are emerging.
In the materials domain, battery recycling, which processes batteries to reuse their key metals, is an emerging growth area addressing large global demand. The specific process used varies by battery type. In general, the battery recycling value chain includes a pre-treatment phase and then a metallurgical process to extract their valuable metals. Pyrometallurgy, the more widely used metallurgical recycling technique, involves using significant amounts of energy to generate high temperatures to melt batteries into alloys. Hydrometallurgy, the more environmentally benign option, employs water-based solutions to retrieve battery metals. Emerging electro-chemical methods also present promise for economically viable recovery of materials.
Supply chain traceability is a capital-light investment theme which is complementary to the reshoring of key materials production. Traceability follows the journey of goods from origin to destination. This involves tracing raw material inputs, components, and processes. With complete visibility over complex supply chains, companies are better equipped to identify solutions for efficiency and decarbonization. Technology approaches employed in this field include barcoding, RFID, blockchain, and GPS oversight. In today’s globalized market economy, organizations with traceable supply chains can benefit from reduced costs, increased customer satisfaction, and a greater ability to comply with complex regulatory frameworks.
Industrial automation is also a capital efficient subsector which achieves impacts at scale across both light and heavy industrial activity. The convergence of cheap sensors, cloud-enabled granular data capture, fast software, and AI-based analytics are driving unprecedented industrial efficiency gains. In the past, sensors were expensive enough to preclude wide scale deployment, and suffered from the need to be hard wired to receive power and transmit data. The cable runs to support this would span hundreds of meters and require additional costs and labor for steel conduit and shielding materials to curtail electromagnetic interference. Today, sensors are wireless and have surpassed the $100/sensor price point needed to foster extreme-scale deployment. This coincides with the build-out of 5G cellular networks, which offers fast data transmission from the edge of the network to the cloud. Edge computing solutions can ingest data from hundreds of thousands of sensors simultaneously, and in conjunction with the cloud, can perform analytics to optimize across facilities or even enterprises. These large-scale optimizations save energy through autonomous coordination as well as control of machinery.
1 https://emp.lbl.gov/news/new-study-refocuses-learning-curve-analysis
2 https://www.iea.org/data-and-statistics/charts/electricity-generation-by-source-oecd-2000-2020
3 https://www.bnef.com/insights/30265/view
4 https://yaleclimateconnections.org/2022/08/electrifying-transportation-reduces-emissions-and-saves-massive-amounts-of-energy/
5 https://www.bnef.com/insights/31009/view
6 https://www.holoniq.com/notes/2022-climate-tech-vc-funding-totals-70-1b-up-89-from-37-0b-in-2021
7 https://www.mckinsey.com/industries/public-and-social-sector/our-insights/the-inflation-reduction-act-heres-whats-in-it
8 https://www.forbes.com/sites/jonathanponciano/2021/11/15/everything-in-the-12-trillion-infrastructure-bill-biden-just-signed-new-roads-electric-school-buses-and-more/?sh=40eb7054161f
9 https://www.nist.gov/news-events/news/2022/03/future-charged-national-electric-vehicle-infrastructure-nevi-formula
10 https://www.mckinsey.com/industries/public-and-social-sector/our-insights/the-chips-and-science-act-heres-whats-in-it
11 https://www.budget.canada.ca/fes-eea/2022/doc/gf-fc-en.pdf
12 https://www.canada.ca/en/department-finance/news/2023/03/a-made-in-canada-plan-affordable-energy-good-jobs-and-a-growing-clean-economy.html#:~:text=Budget%202023%20proposes%20a%20refundable,to%20clean%20technology%20supply%20chains.
13 https://www.budget.canada.ca/2023/report-rapport/chap3-en.html#:~:text=Budget%202023%20proposes%20to%20provide,of%20clean%20technologies%20in%20Canada.
14 https://cib-bic.ca/en/medias/articles/cib-launches-500-million-charging-and-hydrogen-refuelling-infrastructure-initiative/
15 https://www.canada.ca/en/environment-climate-change/services/managing-pollution/energy-production/fuel-regulations/clean-fuel-regulations/regulatory-approach.html
16 https://ec.europa.eu/commission/presscorner/detail/en/ip_23_1661
17 https://www.bnef.com/insights/31009/view
18 https://www.bnef.com/interactive-datasets/2d5d59acd900003d
19 https://www.mckinsey.com/features/mckinsey-center-for-future-mobility/mckinsey-on-urban-mobility/how-the-pandemic-has-reshaped-micromobility-investments
20 https://www.healthandenvironment.org/environmental-health/environmental-risks/built-environment
21 https://www.iea.org/reports/buildings
22 https://www.mckinsey.com/capabilities/operations/our-insights/accelerating-green-growth-in-the-built-environment